
Wondering if your performance this year is consistent with seasonality trends in prior years? Or perhaps you want to know how your rent growth is trending year over year? Or maybe you simply want to know who is winning the most leases right now and why? The Historical’s Report can help aid in this analysis.
In this article, we will discuss the following:
Video Training
Overview of Historicals
The Historicals Report will allow you to track seasonality within your market. You will be able to visualize how your subject property has performed over time relative to your competition. See rent, leasing velocity, and performance trends over the last 4 years to make data driven decisions.
Key Features
- Historic Context: Easily access up to four years of historical data.
- Granular Detail: View data down to daily and unit-level granularity.
- Benchmarking: Compare your property against the market or specific competitors.
- Insightful Visuals: User-friendly, colorful charts make trend analysis straightforward and clear.
Benefits
- Informed Decision Making: Utilize historical insights to guide current and future property management strategies.
- Competitive Analysis: Understand how your property stacks up against competitors in the market.
- Time Efficiency: Simplified visuals ensure quick analysis, saving time for busy Revenue, Asset, or Property Managers.
Metrics within the Historicals Report
The following components of the Historicals Report allow you to view your data in a configurable interval such as the last 7 days, last 12 months, and even the last 3 years. You can then set this data to display in a configurable time window such as daily, weekly, monthly, quarterly, or yearly.
Pricing Trends
View Minimum and Median Rent, NER, Rent/SQ FT and NER/SQ FT across your market or bed types for available and leased units.
Easily see the range of the Minimum or Median advertised prices for your curated comp set. From here, quickly identify the comp who had the highest advertised vs lowest advertised rent over time, as well as the comp median and your subject property placement in the set over a selected time frame.
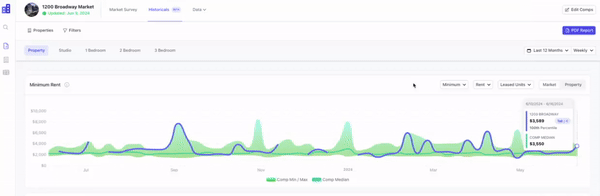
Effortlessly compare your subject property to your comps and see specific property performance by clicking to view by “Property.” From here, you can quickly see which properties are setting the top, middle, and bottom of the market over time given a selected interval and time window.

To see where a particular comp is sitting:
- Click “clear all”.
- Select the comp of choice.
- View the data for your comp or comps of choice.

Alternatively, you can view comps of choice within a set by using the properties filter along the top right hand navigation to filter your data.

Concession History
Easily review concession history for all properties in your market at a property level or down to the bed type. Quickly identify concessions that have been applied and determine when the concession was in place. Being able to see this information historically will allow you to determine if a concession was successful - for example did the concession increase leases?
Concession value will allow you to see the average concession dollar value, calculated as an aggregate of values for your configured time interval.

Alternatively, review the concession percentage of rent, allowing you to see the impact of the concession value relative to the gross rent aggregated over your configured time frame.

Availability Trends
Visualize historical trends related to total availability and newly listed units.

Zoom in on a particular comp to view their total availability and newly listed units over your desired interval and time window. Click “Clear All” and select your desired comp.

Leasing Trends
Explore historical trends related to leased units and net leased units.
Suggestion
Consider leveraging this data to have conversations around leasing- if there were no leases that week, but your property had traffic, where did those potential renters go?

Please Note
Gaps in data could suggest that no leasing occurred during that time period.
Leased Units by Week
You are now able to see how many units a property in your comp set leased week over week. Simply select the time frame in which you wish to view and see the data week over week. This table will make it easier than ever to compare weekly leasing velocity across your comp set.

Exposure and Advertised Occupancy
View Exposure and Advertised Occupancy rates over the last three years.

Identify your market range, median and subject property ranking in the market. Additionally, quickly see how your properties performance is being impacted by new supply in the market.
Suggestion
Need to compare your subject directly to other stabilized units? Easily remove leaseups from the equation by deselecting it from the data set.

Use Cases
Regionals and Property Managers
- Historicals can assist you with making rent and concession recommendations to owners and/or clients.
- See exactly which comps are setting the top, middle and bottom of the market when it comes to Rent and NER.
- Visually compare your property to your closest competitors at a glance to make data driven decisions in real time.
- Easily see performance and trends year over year, and seasonality trends, streamlining the decision making process based on data while allowing you to be more proactive.
Operations
- For owned/managed properties- showcase data to developers to prove the state of your market.
- Set realistic expectations regarding Lease-Up performance by reviewing up to 3 years of historical market data.
Asset and Revenue Management
- Discover how your properties performance is being impacted by new supply in the market.
- Unveil how rent growth is trending year over year.
FAQ
How much historical data does ApartmentIQ have?
Our data can showcase information dating back to October of 2020.
How much raw historical data can I export via CSV?
You are able to extract 2 years of raw historical data via CSV. Should you need additional history, please contact your CSM for pricing information.
What metrics are available with historical data?
You will be able to see Gross Rent, Rent/SQ FT, NER, NER/SQ FT, Leased Units and Net Leased Units, as well as Advertised Occupancy and Exposure.
Can I see rent history for leased units?
Yes - you can see historical advertised rates and last advertised rates for units that were leased.
Can I see how my subject historically compared to a specific comp?
Yes- you can view your comp set overall (your market), or focus on specific comps (your properties).